I was trying to perf LLVM opt this week and got confused because the perf report showed mangled function calls on the stack traces. So I might as well write an article of it and hope it would get some Google juice and save others from confusion.
- To build LLVM with complete stack traces, build with “
CMAKE_BUILD_TYPE=Debug“ - To allow
perfto work on LLVM, build with “LLVM_USE_PERF:=ON“
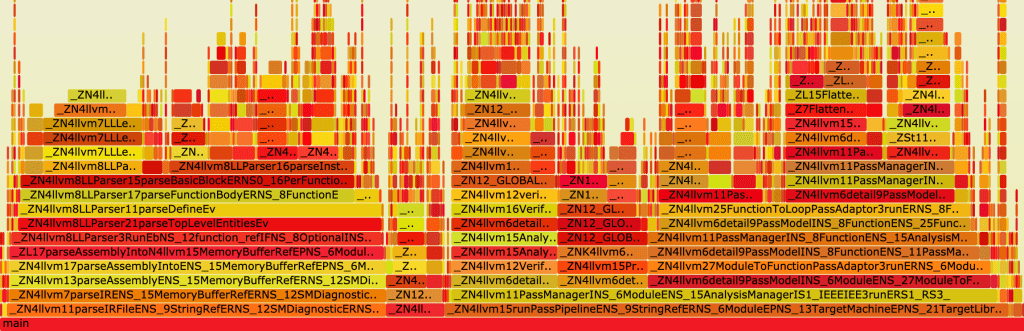
At the very first place I thought the mangle-ed function call names exist because of perf not recognizing the symbols. It turned out I was wrong. If perf does not recognize the symbol it would simply show Unknown. The mixed-up symbol names are name mangling for function calls. (see more here)
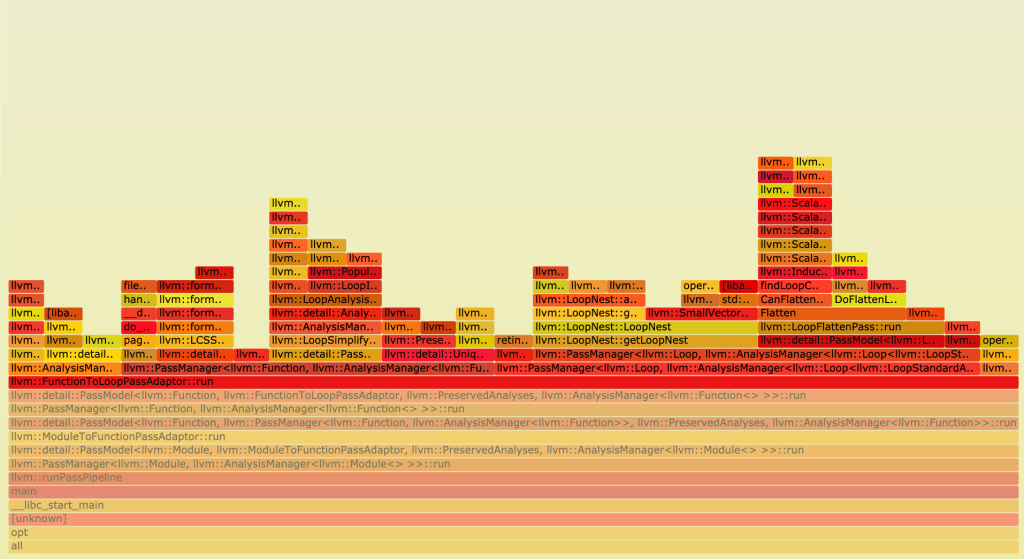
You can remove the mangling simply with llvm-cxxfilt (see more here). For the exact correct mapping you may need to use llvm-cxxmap (see from here).
With the correct build I still get mangled-output. Turned out that the perf I apt-get-ed from is compiled with the de-mangling function turned off. It was a bug filed in linux since 2014 November and I’m still falling into this error on 2021 June 🤢. (on Ubuntu 16.04 linux 4.4.0-131 generic x86_64)
There’s 3 links in the bug thread above that may lead you to the solution. Personally I’ve download the perf tool in mirrors.edge.kernel.org, followed the instructions here to build the correct perf I needed.
- Stack Overflow – perf enable demangling of callgraph
- Stack Overflow – perf shows mangled function names
- Stack Overflow – perf report function names and extra characters
NOTE: you may need to apt-get some dependencies to enable some feature in perf. Be sure to checkout the compile messages when you build from source. You can checkout features enabled with perf version --build-options.
PS: Just in case you came in with your perf not working on your self-compiled code with clang or gcc, you may want to look at this stack-overflow answer.
